If you’ve ever looked at a Forex, crypto, or stock chart, you’ve likely seen rows of colorful bars—some green, some red—forming patterns that seem to tell a hidden story. Those bars are called Japanese candlesticks, and they are one of the most powerful tools traders use to read market psychology and predict future price movement.
Candlestick charts go far beyond numbers. They represent emotion—fear, greed, hesitation, and momentum—all packed into simple shapes. Once you understand how to read them, you’ll gain insight into what buyers and sellers are thinking in real time.
In this guide, we’ll break down the anatomy of a candlestick, explore key single-candle patterns like the Doji, Hammer, and Engulfing, and teach you how to read what the market is “saying” through its candles.
🕯️ The Origin of Japanese Candlesticks
Before we dive in, a bit of history helps put things into perspective. Japanese candlesticks were first developed in the 1700s by Munehisa Homma, a rice trader in Japan. Homma discovered that price movements were not just driven by supply and demand—but also by traders’ emotions.
By recording prices in a visual format, he could identify repeating patterns that reflected how people felt about the market. His method was so effective that it became the foundation for modern technical analysis, long before computers existed.
Today, candlestick charts are the universal language of traders. Whether you trade Forex, stocks, or cryptocurrencies, understanding candlesticks is essential.
🔍 Understanding Candlestick Anatomy
Each candlestick represents a specific period of price movement—for example, one minute, one hour, or one day—depending on your chart’s timeframe.
A candlestick has four main data points:
- Open – The price at which the candle started.
- Close – The price at which the candle ended.
- High – The highest price reached during that period.
- Low – The lowest price reached during that period.
These four values create the body and the wicks (also called shadows) of the candle.
🟩 Bullish Candle (Price Goes Up)
When the closing price is higher than the opening price, the candle is bullish—meaning buyers were in control.
It’s usually colored green or white on most chart platforms.
Example:
- Open: 1.1000
- Close: 1.1050
- High: 1.1060
- Low: 1.0980
The result: a green candle showing that buyers pushed prices higher.
🟥 Bearish Candle (Price Goes Down)
When the closing price is lower than the opening price, the candle is bearish—meaning sellers dominated that session.
It’s usually colored red or black.
Example:
- Open: 1.1050
- Close: 1.1000
- High: 1.1060
- Low: 1.0980
The result: a red candle, signaling that sellers took control.
🕯️ Candle Components
Let’s visualize the structure:
     |      ← Upper Wick (High)
     |
 ┌───────┐
 |       |  ← Candle Body (Open to Close)
 └───────
     |
     |      ← Lower Wick (Low)
- Body: The thick part shows the distance between the opening and closing prices.
- Wick (or Shadow): The thin lines show the highest and lowest prices during that time.
- Color: Indicates whether buyers (green) or sellers (red) won the battle.
Together, these elements form the building blocks of price action storytelling.
📖 Market Storytelling Through Candlesticks
Every candlestick tells a story of what happened in the market during a specific time:
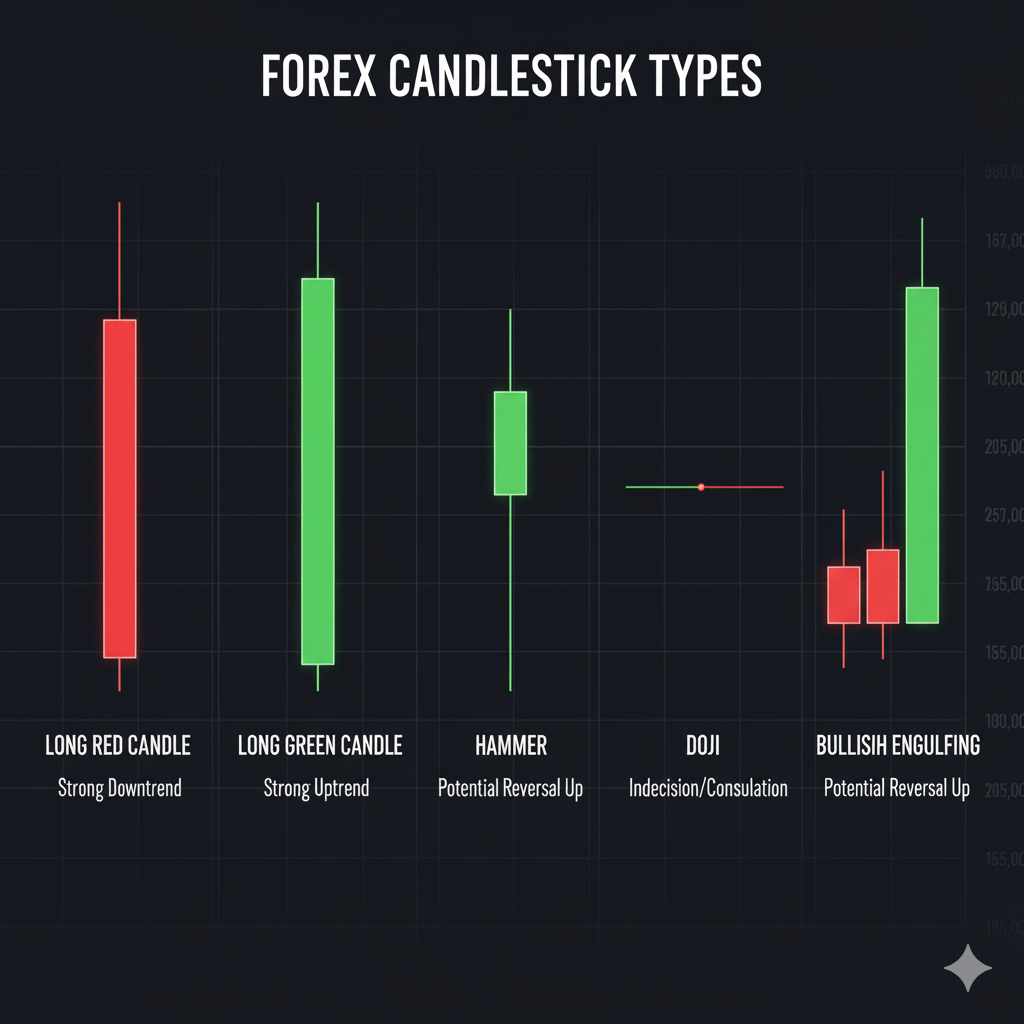
- A long bullish candle = Buyers dominated strongly.
- A long bearish candle = Sellers had full control.
- A small-bodied candle = Market indecision or balance.
- Long wicks on either side = Rejection of certain price levels.
By observing the sequence of candles, traders can understand market momentum, reversals, and trends without needing a single indicator.
🧩 Key Single-Candle Patterns and Their Meaning
Let’s explore the most common and powerful single candlestick patterns every beginner should know:
1. Doji Candle — The Candle of Indecision
A Doji forms when the opening and closing prices are nearly equal, creating a candle with a very small body and long wicks.
It represents indecision between buyers and sellers.
Example:
- Open: 1.1000
- Close: 1.1001
- High: 1.1020
- Low: 1.0980
How to Read It:
- The market moved up and down, but closed near where it opened.
- Neither side had clear control.
- A Doji appearing after a strong trend may signal a potential reversal or pause.
In Practice:
If EUR/USD has been rising for hours and a Doji appears at the top, it could mean buyers are losing steam—and a pullback might follow.
2. Hammer — The Bullish Reversal Signal
A Hammer is a small-bodied candle with a long lower wick and little to no upper wick. It usually appears after a downtrend and indicates potential reversal to the upside.
How to Identify a Hammer:
- Small body near the top of the candle.
- Lower wick is at least twice the length of the body.
- Color can be green or red, but green adds more bullish weight.
Example:
- Open: 1.0950
- Low: 1.0900
- Close: 1.0940
- High: 1.0955
Even though sellers pushed prices down, buyers fought back and closed near the open—showing buying pressure and possible trend reversal.
In Practice:
If USD/JPY has been falling steadily and you spot a hammer near a support level, it might be a signal that the downtrend is ending.
3. Engulfing Candle — The Strong Reversal Indicator
An Engulfing pattern occurs when a candle completely “engulfs” the previous one’s body.
There are two types: Bullish Engulfing and Bearish Engulfing.
🔹 Bullish Engulfing
- Appears after a downtrend.
- The new bullish candle fully covers the previous bearish candle.
- Indicates strong buyer dominance.
Example:
- Day 1: Small red candle (open 1.1000, close 1.0980)
- Day 2: Large green candle (open 1.0970, close 1.1030)
This shows that buyers overwhelmed sellers and may start a new upward move.
🔹 Bearish Engulfing
- Appears after an uptrend.
- The new bearish candle fully covers the previous bullish candle.
- Indicates seller takeover.
Example:
- Day 1: Small green candle (open 1.2000, close 1.2025)
- Day 2: Large red candle (open 1.2030, close 1.1950)
Sellers have regained control, hinting at a possible trend reversal downward.
🧠 Bonus Patterns Worth Knowing
While Doji, Hammer, and Engulfing are foundational, here are two more that add depth to your chart reading:
🔸 Shooting Star
- Opposite of a hammer.
- Appears at the top of an uptrend with a long upper wick and small body near the bottom.
- Suggests buyers tried to push prices up but failed—sellers might take over next.
🔸 Spinning Top
- Small body with wicks on both sides.
- Represents market indecision, similar to a Doji but with slightly more movement.
📊 Reading Context: Candles Don’t Work Alone
Candlestick patterns are most effective when analyzed in context—with trends, support/resistance, and volume.
Example:
- A Hammer near a strong support zone carries more meaning than one floating in the middle of a range.
- A Doji after a long uptrend may warn of exhaustion, but during consolidation, it might simply confirm indecision.
🔍 Combine Candlesticks with:
- Support and Resistance – Look for key price levels where patterns form.
- Trend Lines – Identify if the candle is signaling a continuation or reversal.
- Volume – High volume adds strength to candlestick signals.
🪞 The Market Psychology Behind Candles
Candlesticks are more than shapes—they’re a visual reflection of human behavior.
Here’s how traders interpret emotions behind the patterns:
| Candle Type | Trader Emotion | Market Message |
|---|---|---|
| Long Green Candle | Strong optimism | Buyers in control |
| Long Red Candle | Fear or panic | Sellers dominate |
| Doji | Uncertainty | Possible reversal or pause |
| Hammer | Buyer strength | Reversal potential |
| Engulfing | Power shift | Trend change signal |
By learning to “read” these emotions, you start seeing the market as a story of buyers vs. sellers, not just price data.
🧭 Example: Telling a Market Story Through Candles
Let’s analyze a short price sequence on EUR/USD:
- Strong red candles – Sellers are dominating, pushing price downward.
- Hammer appears – Buyers push back, rejecting lower prices.
- Doji forms – Market indecision; traders wait for confirmation.
- Bullish Engulfing candle – Buyers take full control, signaling a trend reversal.
By simply reading this “story,” you can make more confident trading decisions without relying solely on lagging indicators.
🧩 Practice: How Beginners Can Train Candle Reading Skills
- Start on higher timeframes (1H or 4H) – Candles form slower and are more reliable.
- Focus on major pairs like EUR/USD or GBP/USD for smoother patterns.
- Mark key candles (Doji, Hammer, Engulfing) and observe what happens next.
- Backtest – Look at past charts to see how candles reacted near support/resistance zones.
- Combine with confirmation tools (like trendlines or moving averages) to increase accuracy.
The goal is to make candlestick interpretation second nature—so you instantly recognize what the market is telling you.
In Conclusion
Mastering Japanese candlesticks is like learning to read the market’s diary. Every candle is a snapshot of trader behavior, showing who’s in control and where the price might go next.
To recap:
- Candlesticks are built from Open, High, Low, Close data and show market emotion.
- The body tells you the strength of the move, and wicks show rejection levels.
- Key patterns like Doji, Hammer, and Engulfing reveal turning points and continuation clues.
- Context—trend direction, support/resistance, and volume—gives each candle its true meaning.
When you master these basics, you won’t just see price charts—you’ll read stories of struggle, victory, and psychology between bulls and bears.
Candlestick analysis is more than technical—it’s market storytelling.